A possible path for employment in the years ahead

In this follow-up Note for Discussion, we can complete the decomposition of the working-age population (WAP) into its component parts of participation (those people of working age who are working or looking for work), the labor force, unemployment, and, now, employment. Taking a view on employment possibilities is critical because the economic potential of Greece to produce output (GDP) comprises how many persons are in employment coupled with their labor productivity.
Employment. In the scenarios of the preceding note, we have defined the size of the labor force by assuming a certain participation rate out of the WAP going forward. Then we took a view on a reasonable downward path for unemployment. With two out of three variables determined, the evolution of employment is then determined automatically because employment + unemployment = the labor force.
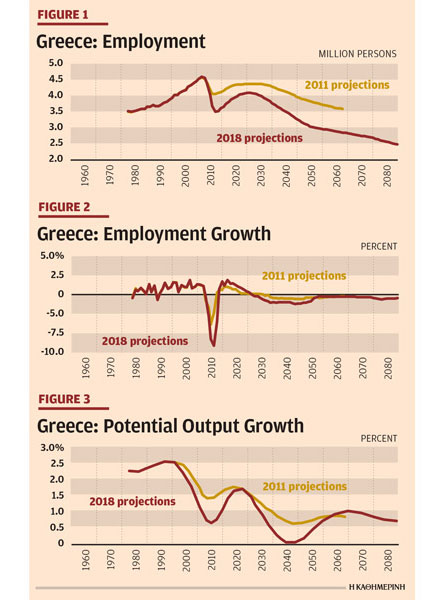
The implication for the evolution of employment is shown in Figure 1.
With the new data from 2018, we can see that the decline in employment was steeper compared with the scenario that I thought most likely back in 2011. Also, the initial recovery in employment in the 2018 vintage (the slope of the line), given the assumptions and objectives I have stated, is slightly faster than the recovery in employment from the 2011 vintage through about 2025.
But then the gravitational pull of a shrinking population and a shrinking working-age population starts diminishing the possibility for employment expansion as well, and the level of employment in the new vintage is lower than it was with the 2011 projections. This is consistent with having a smaller overall population and thus a smaller economy.
The government can strive for a number of policies to lift up this future level of employment, if society were to want this, including allowing more immigration and integration of foreigners into Greek society, and other policies. Improving competitiveness through lowering costs and making product and labor markets more flexible is another approach to make the future economy bigger. But all of these policies attract their own resistance from established interests who prefer to keep the status quo, so this is a slowly evolving process that takes time and requires a good understanding by society of what the options are.
The preference set that will eventually determine the possibilities for a given outcome is entirely sovereign for Greece, and it is determined through the domestic political process – no outside institution or country can, or should, determine this. The only thing that outside actors involved with Greece can/should do is assess consistency of the preference set of Greece with the professed policies. Preferences are sovereign; the need for consistency is a law of nature.
Finally, we can look at the growth rate of employment as a variable of special interest. Figure 2 shows the growth rate of employment in both scenarios.
The hit to employment from the deep recession in 2010-15 is clearly visible. It is also obvious that the evolution of employment in the long run follows the evolution of growth in the working-age population, because I assume that participation and the unemployment rate will gravitate to a long-run value that I have kept constant in the long-run projections. Thus, the reduction in the population projections in the new 2018 data is telescoped all the way through to the possibility to expand employment in the long run.
If the new projections are closer to what will happen than the vintage from 2011, then it follows that the 2030s-40s are going to be difficult for Greece, because employment growth will follow, downward, the decline in population, as projected. This means that output growth in those decades will be particularly weak, just as Greece, together with partner countries in Europe, have to consider what to do with the debt burden as the current moderation in amortization needs and low interest rates need to come up for debate again. It is further evident that if Greece is going to tackle this problem in earnest, the next 15 years need to be used to lower the debt as much as possible.
Seeing through the noise
The government needs to take an intertemporal view of the whole projection instead of reacting to annual ups and downs in growth – there are bound to be up years as well as down years, but policy needs to see through this noise and focus steadily on the underlying longer-term, or structural, signals that we try to extract and make visible in these projections.
Finally, we can now develop a second and more precise estimate of “potential growth” for the Greek economy. In the first and “primitive” estimate of Discussion Note 1, we simply used the growth rate of the WAP multiplied by an assumption of productivity growth per person of 1.5 percent a year to arrive at an average potential growth rate of around 0.5 percent a year, as compared with the 1.0 percent a year from the 2011 analysis. But in the above, we have shown that sometimes employment can grow faster than the working-age population for a variety of reasons. The most intuitive way to see this is that a recession first creates unemployment. This process can reverse when the economy recovers, whereby employment can grow faster as unemployment is reduced. Also, the participation within the WAP could increase if more people start looking for work and increase the number of persons that are active in the economy. Thus, at least for a while, employment can grow faster than the working-age population.
The second and more detailed estimate of “potential growth” is then obtained by multiplying the rate of growth in employment with the productivity growth assumption of 1.5 percent a year per employed person. Since employment growth is more variable than WAP growth, this second estimate can be more precise when we try to project potential growth and how large output could get.
This is important, in turn, because it allows an assessment of how actual growth in the economy is progressing relative to potential growth in the economy. If actual growth speeds up above potential growth, then the economy can start to heat up as input resources start to run scarce – the possible resulting increase in inflation needs to be avoided in order to keep the economy competitive for the long run.
Figure 3 shows the results of estimated potential growth for the 2011 and 2018 scenarios. The growth rate is smoothed with a statistical formula to take out outliers from year-to-year that are noise and not a true signal of potential growth. The figure shows that the scenario from 2011 suggests a recovery in potential growth to about 1.7 percent by 2020 as the economy rebounds from the recession and the large volume of unemployed persons is being reintegrated into the employment rolls. Then the shrinking demographics start to reassert themselves, after the reservoir of the unemployed is reabsorbed, and pull potential growth down gradually to a low of around 0.7 percent by the 2040s. Over the whole period 2010-50, this scenario has an average potential growth rate of 1.1 percent – the number that already showed up in the previous estimate.
The 2018 scenario with lower demographic growth also shows lower potential growth over the forecast horizon, until the demographic developments converge with the previous scenario after 2050. We can now see that potential growth also peaks at around 1.7 percent a year in 2020 and dips in the long run to a low of zero around 2040. The average growth rate in this scenario over the period 2010-80 is 0.8 percent a year, some 0.3 percentage points lower than obtained in the 2011 scenario. The interval of cumulative output loss over such a long-time horizon is considerable and adds to the importance to think further about how to address the debt, as the economy is likely to be smaller in the future than was thought before.
Some closing thoughts
These projections are not “predictions” but rather a scenario or a narrative of what could be in store if the revised demographic projections pan out as presented.
The annual ups and downs in any economy can be quite large around these longer-run averages (the noise in the data can be large relative to the underlying structural signal). Noise should not be interpreted as a “new normal,” and we should not draw hasty conclusions that the government is succeeding or failing, based on temporary ups and downs. Rather they should be compared with the estimates of underlying potential. This will tell us whether the economy is speeding up or slowing down relative to potential, and whether policy needs to worry about overheating or too much cooling down. Good data and close monitoring are essential.
– Macroeconomies are strings of interrelated variables, as the analysis from population estimates down the line to employment and unemployment has shown. Thus, unemployment and employment will vary in larger amounts than the labor force, and the labor force will vary more than the working-age population, and the working-age population will vary more than the overall population. Understanding this general equilibrium system, where everything is simultaneously connected, is important when assessing policy needs and whether government intervention is required or not. Sometimes temporary disturbances in employment or unemployment are only noise and the government should not overreact to short-term blips in the data.
– Keeping the public informed and having a continuous dialogue with social partners in unions and employers’ organizations is essential to build trust and understanding why certain policies are necessary and advisable. Regular updates of the underlying potential calculations are important; this will give clues where our understanding of what is happening is lacking so that we can zero in on surprises in the data.
– Other analysts may have different assumptions and techniques. Slightly different classification of the data can also affect the analysis. The more discussion on differences and where they come from, the better the understanding of what is going on. That is how countries make true progress.
– We have up to now assumed that labor productivity in Greece per employed worker can increase at 1.5 percent a year. In the next Discussion Note 4, we can check the data to see if this starting-point assumption for other countries also holds for Greece, and whether labor productivity growth is a constant or whether it varies over time, and why.
Bob Traa is an independent economist. This is the third in a series of articles by him for Kathimerini titled “Notes for Discussion – Essays on the Greek Macroeconomy.”